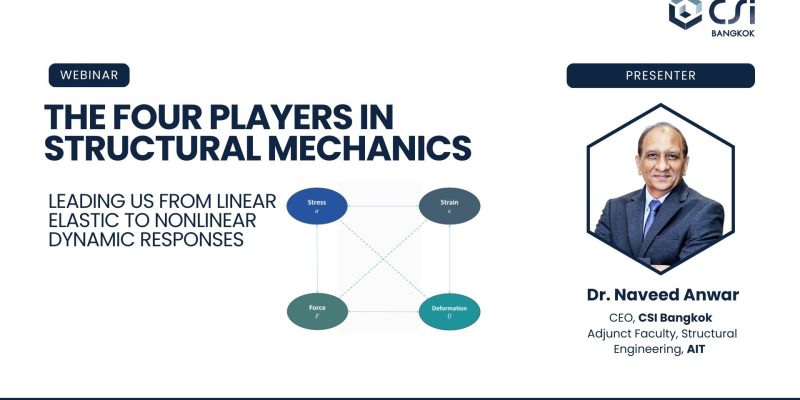
In structural design, strength interaction curves (P-M diagrams) are widely used to assess section capacity under combined axial and flexural loads. However, they only tell part of the story. These capacity surfaces, limited by arbitrary strain cutoffs and code-based reduction factors, cannot capture the real behavior of a section throughout its loading history.
In this deep-dive session, we will explore the fundamental difference between strength capacity and deformation capacity, using side-by-side visuals and derivations.
Using detailed examples and visualization of section behavior, we’ll demonstrate how moment-curvature analysis answers questions that strength-based design simply cannot.
Students will learn:
- How P-M interaction curves are constructed – and their assumptions
- The full procedure for developing moment-curvature and moment-rotation curves
- How moment-curvature reveals stiffness degradation, ductility, damage, and energy dissipation
- Why moment-curvature is essential for performance-based design, seismic evaluation, and nonlinear analysis